
REAL-TIME TREASURY RATES.
Reverse Mortgage Treasury (CMT) as Transitions to SOFR
 |
Michael G. Branson, CEO of All Reverse Mortgage, Inc., and moderator of ARLO™, has 45 years of experience in mortgage banking, with the past 20 years devoted exclusively to reverse mortgages. A Forbes Real Estate Council member, he developed the industry's first fixed-rate jumbo reverse mortgage and has been featured in Forbes, Kiplinger, the LA Times, and Yahoo Finance. (License: NMLS# 14040) |
 |
Cliff Auerswald, President of All Reverse Mortgage, Inc., and co-creator of ARLO™ — the industry's first real-time reverse mortgage pricing engine — has 27 years of experience in mortgage banking, with 20+ years focused exclusively on reverse mortgages. A recognized expert in reverse mortgage technology and consumer education, he has been featured in Kiplinger, Yahoo Finance, Realtor.com, and HousingWire. (License: NMLS# 14041) |
 Michael G. Branson
 Cliff Auerswald
Overview
With GNMA’s recent announcement, HECM ARMs using LIBOR as their index will soon not be viable to originate. While LIBOR has been destined to be phased out for some time, this unexpected announcement will require a faster transition than was expected.
The framework around SOFR, the anticipated replacement to LIBOR, has not been fully developed yet, and as such adjustable-rate HECM loans will need to use CMT (Constant Maturity Treasury)– at least in the short term.
This will be a back-to-the-future for the reverse mortgage industry. CMT-based HECM products were used in the initial ARMs. They were the only index available until the FHA added LIBOR in October 2007.
Background of the Indices
LIBOR, SOFR, and CMT represent the cost of borrowing money from a large financial institution.
LIBOR – London Inter-Bank Offer Rate
This is a measure of the cost to Banks of borrowing cash from each other for relatively short periods. There are different LIBOR rates for different borrowing periods and different currencies.
LIBOR rates were determined by a survey of panel banks conducted by the British Bankers Association. They were not necessarily based on actual transactions.
This methodology allowed for manipulation of the LIBOR rates by large financial institutions, and as a result, regulators have mandated the phase-out of LIBOR.
SOFR – Secured Overnight Financing Rate
As the name indicates, this measures the cost of borrowing cash overnight, secured by Treasuries as collateral.
It is derived from actual activity in the Treasuries repurchase (Repo) market, where banks and investors borrow or loan Treasury securities – hundreds of billions of dollars are traded daily.
The US Federal Reserve’s Alternative Reference Rates Committee (ARRC) selected SOFR as the replacement for LIBOR in June 2017. By its very definition, SOFR is an overnight rate, so creating longer-term SOFR rates has proved problematic.
Treasury (CMT) – Constant Maturity Treasury
CMT rates are designed to reflect the United States Treasury’s cost of borrowing. CMT yields are read directly from the Treasury’s daily yield curve, derived from actual yields on Treasury Securities.
Because Treasury instruments have a set maturity date and are issued according to need, it is very rare for the maturity of Treasury security to align with an exact period, e.g., Twelve Months, so interpolation ( weighted averaging) is used to determine the Constant Maturity yields. The Federal Reserve publishes CMT yields.
Why is the index changing?
The London Interbank Offered Rate, or LIBOR, reflects the average interest rate that major global banks pay to borrow money from each other.
We have known for some time that the industry sought to discontinue the LIBOR index after some banks provided purported interest rate figures that did not truly reflect the rate at which they could borrow.
After it was discovered that this index was subject to manipulation, trust in the LIBOR index as an indicator of the global economy’s health was lost.
What does this mean for you?
If you have a current reverse mortgage in process on the 1-year LIBOR ARM reverse mortgage, it will no longer be able to close after November 30, 2020.
If you are processing an adjustable rate reverse mortgage at this time, if that loan does not close by November 30, 2020, the terms will change to a 1-month CMT ARM (Constant Maturity Treasury) with a life cap of 10% instead of the current 5% life cap on the 1-year LIBOR ARM.
The Good News!
The good news is that the CMT index is extremely low and that no borrower in the history of reverse mortgages has ever reached the capped rate. This means that the lifetime cap may be higher, but if the rates never hit the cap, the cap amount is a moot point.
Top FAQs
Is the CMT rate like the LIBOR index?
What will happen after you close your loan on a Treasury Index?
What margins will be available; will they be the same as they are now?
The available CMT margins will remain the same as those currently available under LIBOR. However, some of the lowest margin rates may not be offered due to the lower pricing of CMT loans. Also, given investor focus on loans originated with an expected rate close to the floor, there will be impetus to avoid simply adding higher margins.
What will this do to short- and long-term pricing if we go to the CMT or SOFR?
What will we use for the Jumbo LOC rate, or will it not change since LIBOR is not officially going away until next year?
What difference, if any, will this have on expected rates?
How will CMT impact initial rates vs LIBOR rates?
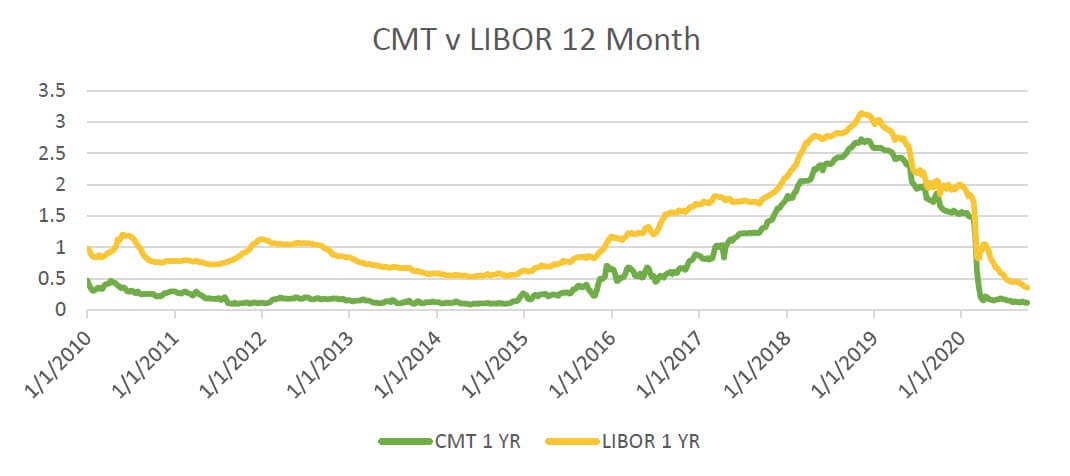
Currently 12 Month LIBOR 0.37% v 12 Month CMT 0.12%
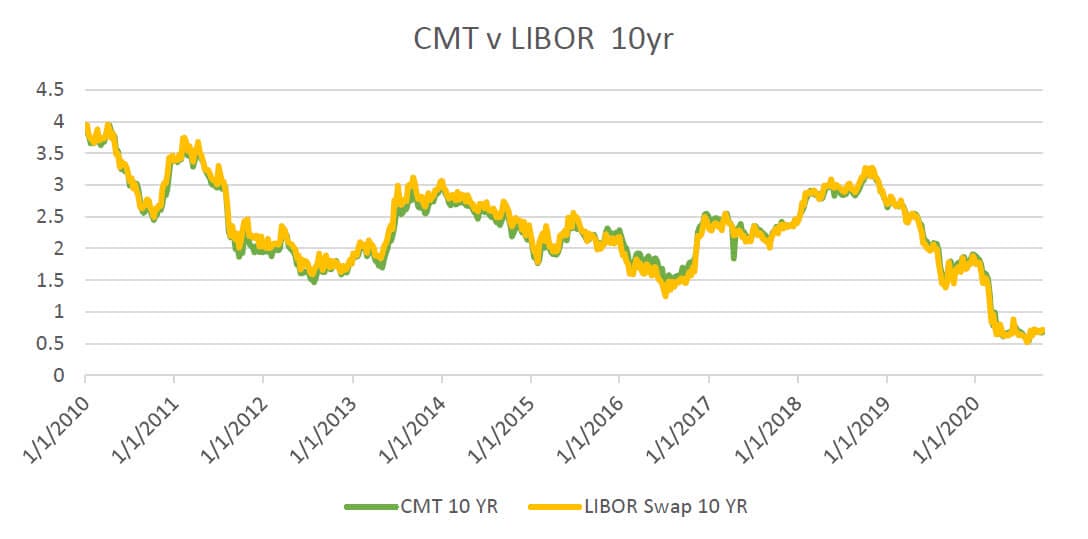
Currently, 10 Year LIBOR Swap 0.68% v 10 Year CMT 0.67%.
10-Year Treasury Rate History (CMT)
10-year Treasury Rate History
Rate (%) Good Through Modified On
1.66 3/29/2021 3/22/2021
1.57 3/22/2021 3/15/2021
1.49 3/15/2021 3/8/2021
1.42 3/8/2021 3/1/2021
1.31 3/1/2021 2/22/2021
1.18 2/22/2021 2/16/2021
1.14 2/16/2021 2/8/2021
1.06 2/8/2021 2/1/2021
1.11 2/1/2021 1/25/2021
1.13 1/25/2021 1/19/2021
1.03 1/19/2021 1/11/2021
0.94 1/11/2021 1/4/2021
0.95 1/4/2021 12/28/2020
0.93 12/28/2020 12/21/2020
0.93 12/21/2020 12/14/2020
0.92 12/14/2020 12/7/2020
0.87 12/7/2020 11/30/2020
0.87 11/30/2020 11/23/2020
0.93 11/23/2020 11/16/2020
0.83 11/16/2020 11/9/2020
0.82 11/9/2020 11/2/2020
0.83 11/2/2020 10/26/2020
0.74 10/26/2020 10/19/2020
0.78 10/19/2020 10/13/2020
1-Month Treasury Rate History (CMT)
1-Month Treasury Rate History
Rate (%) Good Through Modified On
0.01 3/29/2021 3/22/2021
0.04 3/22/2021 3/15/2021
0.04 3/15/2021 3/8/2021
0.03 3/8/2021 3/1/2021
0.03 3/1/2021 2/22/2021
0.04 2/22/2021 2/16/2021
0.04 2/16/2021 2/8/2021
0.06 2/8/2021 2/1/2021
0.07 2/1/2021 1/25/2021
0.09 1/25/2021 1/19/2021
0.09 1/19/2021 1/11/2021
0.08 1/11/2021 1/4/2021
0.08 1/4/2021 12/28/2020
0.08 12/28/2020 12/21/2020
0.08 12/21/2020 12/14/2020
0.07 12/14/2020 12/7/2020
0.08 12/7/2020 11/30/2020
0.08 11/30/2020 11/23/2020
0.1 11/23/2020 11/16/2020
0.09 11/16/2020 11/9/2020
0.08 11/9/2020 11/2/2020
0.08 11/2/2020 10/26/2020
0.1 10/26/2020 10/19/2020
0.09 10/19/2020 10/13/2020
1-Year Treasury Rate History (CMT)
| 1-year Treasury Rate History | ||||||||||||
|---|---|---|---|---|---|---|---|---|---|---|---|---|
| Rate (%) | Good Through | Modified On | ||||||||||
| 0.07 | 3/29/2021 | 3/22/2021 | ||||||||||
| 0.09 | 3/22/2021 | 3/15/2021 | ||||||||||
| 0.08 | 3/15/2021 | 3/8/2021 | ||||||||||
| 0.08 | 3/8/2021 | 3/1/2021 | ||||||||||
| 0.07 | 3/1/2021 | 2/22/2021 | ||||||||||
| 0.07 | 2/22/2021 | 2/16/2021 | ||||||||||
| 0.07 | 2/16/2021 | 2/8/2021 | ||||||||||
| 0.09 | 2/8/2021 | 2/1/2021 | ||||||||||
| 0.1 | 2/1/2021 | 1/25/2021 | ||||||||||
| 0.11 | 1/25/2021 | 1/19/2021 | ||||||||||
| 0.1 | 1/19/2021 | 1/11/2021 | ||||||||||
| 0.11 | 1/11/2021 | 1/4/2021 | ||||||||||
| 0.09 | 1/4/2021 | 12/28/2020 | ||||||||||
| 0.09 | 12/28/2020 | 12/21/2020 | ||||||||||
| 0.1 | 12/21/2020 | 12/14/2020 | ||||||||||
| 0.11 | 12/14/2020 | 12/7/2020 | ||||||||||
| 0.11 | 12/7/2020 | 11/30/2020 | ||||||||||
| 0.11 | 11/30/2020 | 11/23/2020 | ||||||||||
| 0.12 | 11/23/2020 | 11/16/2020 | ||||||||||
| 0.13 | 11/16/2020 | 11/9/2020 | ||||||||||
| 0.12 | 11/9/2020 | 11/2/2020 | ||||||||||
| 0.13 | 11/2/2020 | 10/26/2020 | ||||||||||
| 0.13 | 10/26/2020 | 10/19/2020 | ||||||||||
| 0.13 | 10/19/2020 | 10/13/2020 |
ARLO recommends these helpful resources:


November 11th, 2020
November 12th, 2020