
America's #1 Rated Reverse Mortgage Lender*
Reverse Mortgage Amortization Schedule — How Your Loan Balance, Interest & Equity Change Over Time
 |
Michael G. Branson, CEO of All Reverse Mortgage, Inc., and moderator of ARLO™, has 45 years of experience in mortgage banking, with the past 20 years devoted exclusively to reverse mortgages. A Forbes Real Estate Council member, he developed the industry's first fixed-rate jumbo reverse mortgage and has been featured in Forbes, Kiplinger, the LA Times, and Yahoo Finance. (License: NMLS# 14040) |
 |
Cliff Auerswald, President of All Reverse Mortgage, Inc., and co-creator of ARLO™ — the industry's first real-time reverse mortgage pricing engine — has 27 years of experience in mortgage banking, with 20+ years focused exclusively on reverse mortgages. A recognized expert in reverse mortgage technology and consumer education, he has been featured in Kiplinger, Yahoo Finance, Realtor.com, and HousingWire. (License: NMLS# 14041) |
 Michael G. Branson
 Cliff Auerswald
Before you decide if a reverse mortgage fits your needs, it’s smart to look at how the loan could grow and how your home equity might change over time. One of the best tools for this is the reverse mortgage amortization schedule.
This schedule shows a year-by-year estimate of your loan balance. This interest will be added, any available credit line if you choose an adjustable-rate option, and your projected home value based on an assumed appreciation rate. Reviewing it early helps you see how different choices, such as taking a lump sum, monthly draws, or leaving funds in a credit line, could affect your future equity.
For fixed-rate loans with a single upfront draw, the schedule can be very accurate because the interest rate doesn’t change. With adjustable-rate loans, planning remains valuable, even though actual rates and appreciation can fluctuate over time.
Want your own spreadsheet? Download our free Excel amortization calculator here and run “what if” scenarios with your own numbers.
Components of an Amortization Schedule
A reverse mortgage amortization schedule illustrates how your loan and home equity may change from year to year. The table usually includes:
- Year — how long you’ve had the loan
- Interest rate — the rate applied each year
- Interest accrued — how much interest was added to the balance
- Loan balance — what you would owe if you made no payments
- Home value — an estimate of what your property may be worth
- Available credit line (if adjustable) — how much unused credit has grown
- Remaining home equity — your estimated equity after the loan balance and growth
If your loan includes a line of credit or monthly draws, these will also appear in the schedule.
Because it’s forward-looking, some numbers are estimates. Lenders often use 4% annual home appreciation as a reasonable long-term average. Over the past 25 years, national appreciation has averaged about 3.9% (even including the 2008 housing crash). In some years, values may grow faster; in others, they may grow slower or even decline.
If you live in an area where home prices rise slowly, you can ask your lender to use a lower appreciation rate to see a more conservative projection.
Tip: The schedule is only a forecast. Your actual results will depend on future market values, interest rates, and how you use your funds.
Amortization Schedule Reference Table
| Column | What It Shows |
|---|---|
| Year | Each year since your reverse mortgage began |
| Interest Rate | The rate used to calculate interest for that year |
| Interest Accrued | Total interest added to the loan balance that year |
| Loan Balance | Your running total owed if you make no payments |
| Home Value (Estimated) | Projected property value using your chosen appreciation rate |
| Available Credit Line | (For adjustable-rate loans) Shows how much your line of credit has grown if unused |
| Remaining Home Equity | Your home’s value minus the reverse mortgage balance |
Impact of Interest Rates
Reverse mortgages work differently from traditional home loans because they’re negatively amortizing. That means your loan balance grows over time if you don’t make voluntary payments.
If you choose an adjustable-rate reverse mortgage, both your interest rate and the available line of credit can change. The unused portion of your credit line increases at the same rate charged on the loan, plus the FHA mortgage insurance accrual rate.
Good to know: You are only charged interest on the money you actually borrow, not on the unused credit line or its growth. That growth means you have more funds available later if needed, and it costs nothing to keep the line open.
When you start the process, your lender will prepare an initial amortization schedule based on the home value you provide. Your reverse mortgage counselor will review it with you and may run their own version; both should match if the same numbers are used. If they don’t, ask questions; differences usually arise from different home values, interest rate assumptions, or loan amounts used to pay off existing debt.
After your appraisal, your lender updates the schedule to reflect the appraised value, ensuring the figures are accurate for closing. This final schedule is one of the documents you’ll sign, confirming you understand how interest will accumulate over time.
Impact of Interest Rates – Reverse mortgages are negatively amortizing — meaning your loan balance grows over time if you don’t make voluntary payments. With an adjustable-rate loan, both your interest rate and your available credit line can change. The unused portion of your credit line grows at the same rate as the loan charge plus the FHA mortgage insurance accrual rate. Good to know: You only pay interest on money you actually borrow, not on unused credit line growth.
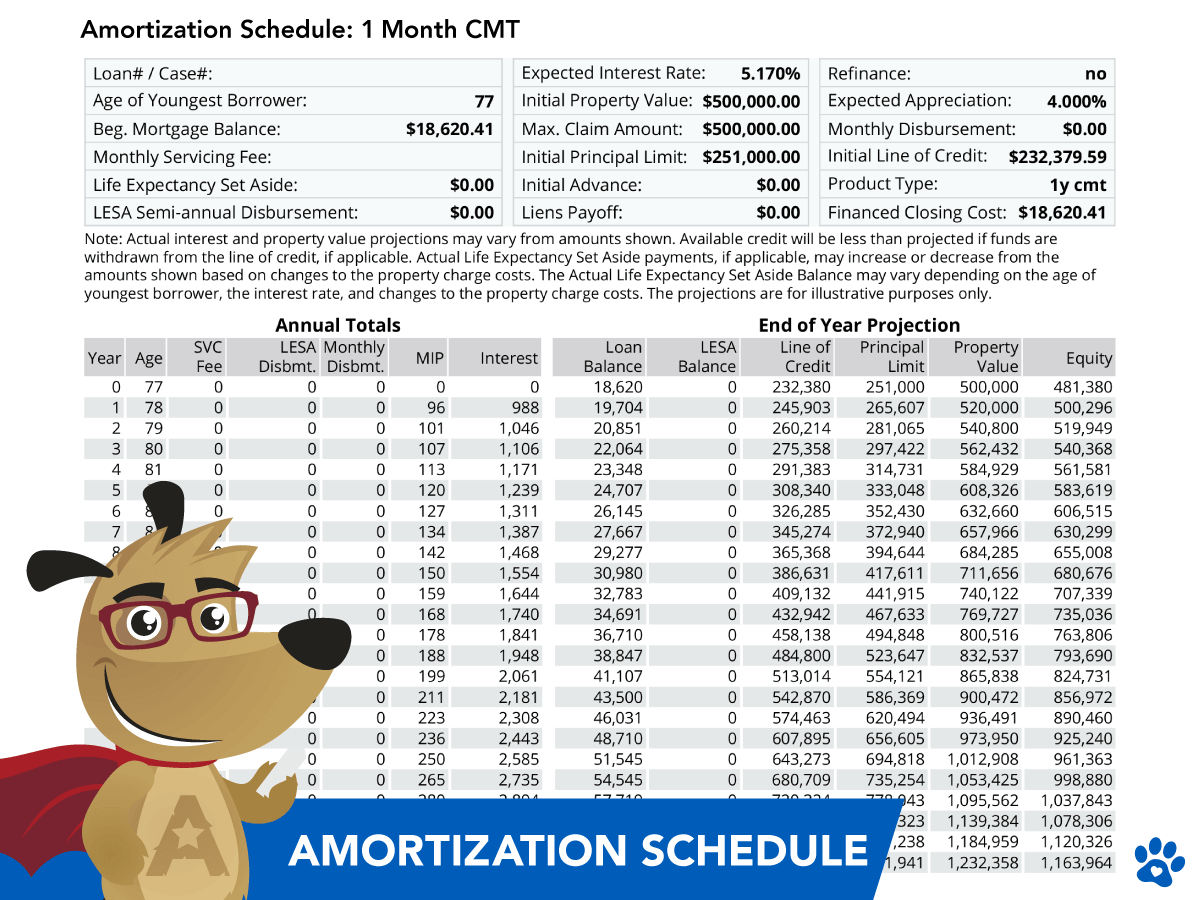
Adjustable-Rate Amortization Example
With an adjustable-rate reverse mortgage, the amortization schedule illustrates how both your loan balance and available credit line can fluctuate over time. Because interest rates can fluctuate, the schedule uses current assumptions; however, if rates rise, your available credit could increase faster than the example indicates.
For example, for a 77-year-old borrower with a $500,000 home:
| Year | Available Credit Line (if untouched) |
|---|---|
| Start | $232,379 |
| After 1 year | $245,903 |
| After 5 years | $308,340 |
(See the sample amortization chart below for a visual of how this works.)
Fixed-Rate Amortization Example
With a fixed-rate reverse mortgage, you’ll see one clear interest rate for the life of the loan. The amortization schedule will show:
- Initial loan balance (including any financed closing costs and mortgage insurance premium)
- Annual interest rate
- How the balance is expected to grow year by year
- Projected home equity as the property value changes
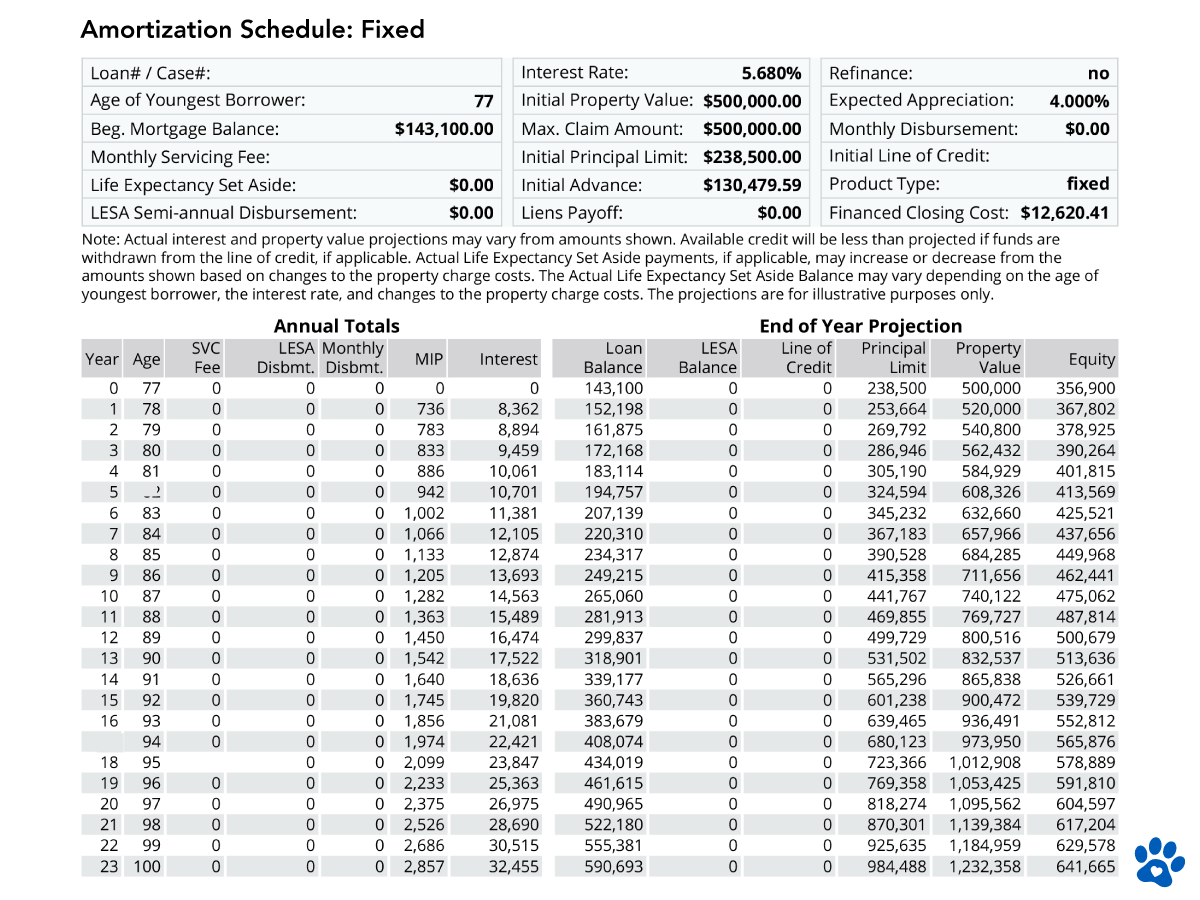
For example, on a $500,000 home, a 77-year-old borrower
| Year | Estimated Loan Balance | Monthly Interest & MIP (approx.) |
|---|---|---|
| 1 | $143,100 | $1,304 |
| 5 | $183,114 | $1,304 |
If the borrower makes no payments, the balance grows over time. But this schedule is also helpful if you want to control or reduce the balance. By reviewing your monthly statement (provided by your servicer), you’ll know exactly what you need to pay each month to keep the balance steady or pay it down.
Amortization FAQs
How is a reverse mortgage amortized?
Do reverse mortgages have negative amortization?
Is negative amortization a bad thing?
How is interest calculated on a reverse mortgage?
Are reverse mortgage amortization schedules customizable for hypothetical scenarios?
When paying off a reverse mortgage after leaving the home, should the payoff be based on the current appraised value or the projected 4% annual appreciation shown in some estimates?
Understanding the Numbers
The amortization schedule can appear complicated, as it provides a snapshot of your loan over several years, including all loan components. This is another reason you’ll want to work with an experienced reverse mortgage lender who can walk you through the numbers in detail.
ARLO recommends these helpful resources:


October 7th, 2025
October 7th, 2025
November 18th, 2022
November 23rd, 2022
June 21st, 2020
June 23rd, 2020